Link for the activity: Candy Factory
On the first page of the printout have the students make predictions for how many M&M's there will be in their package. 

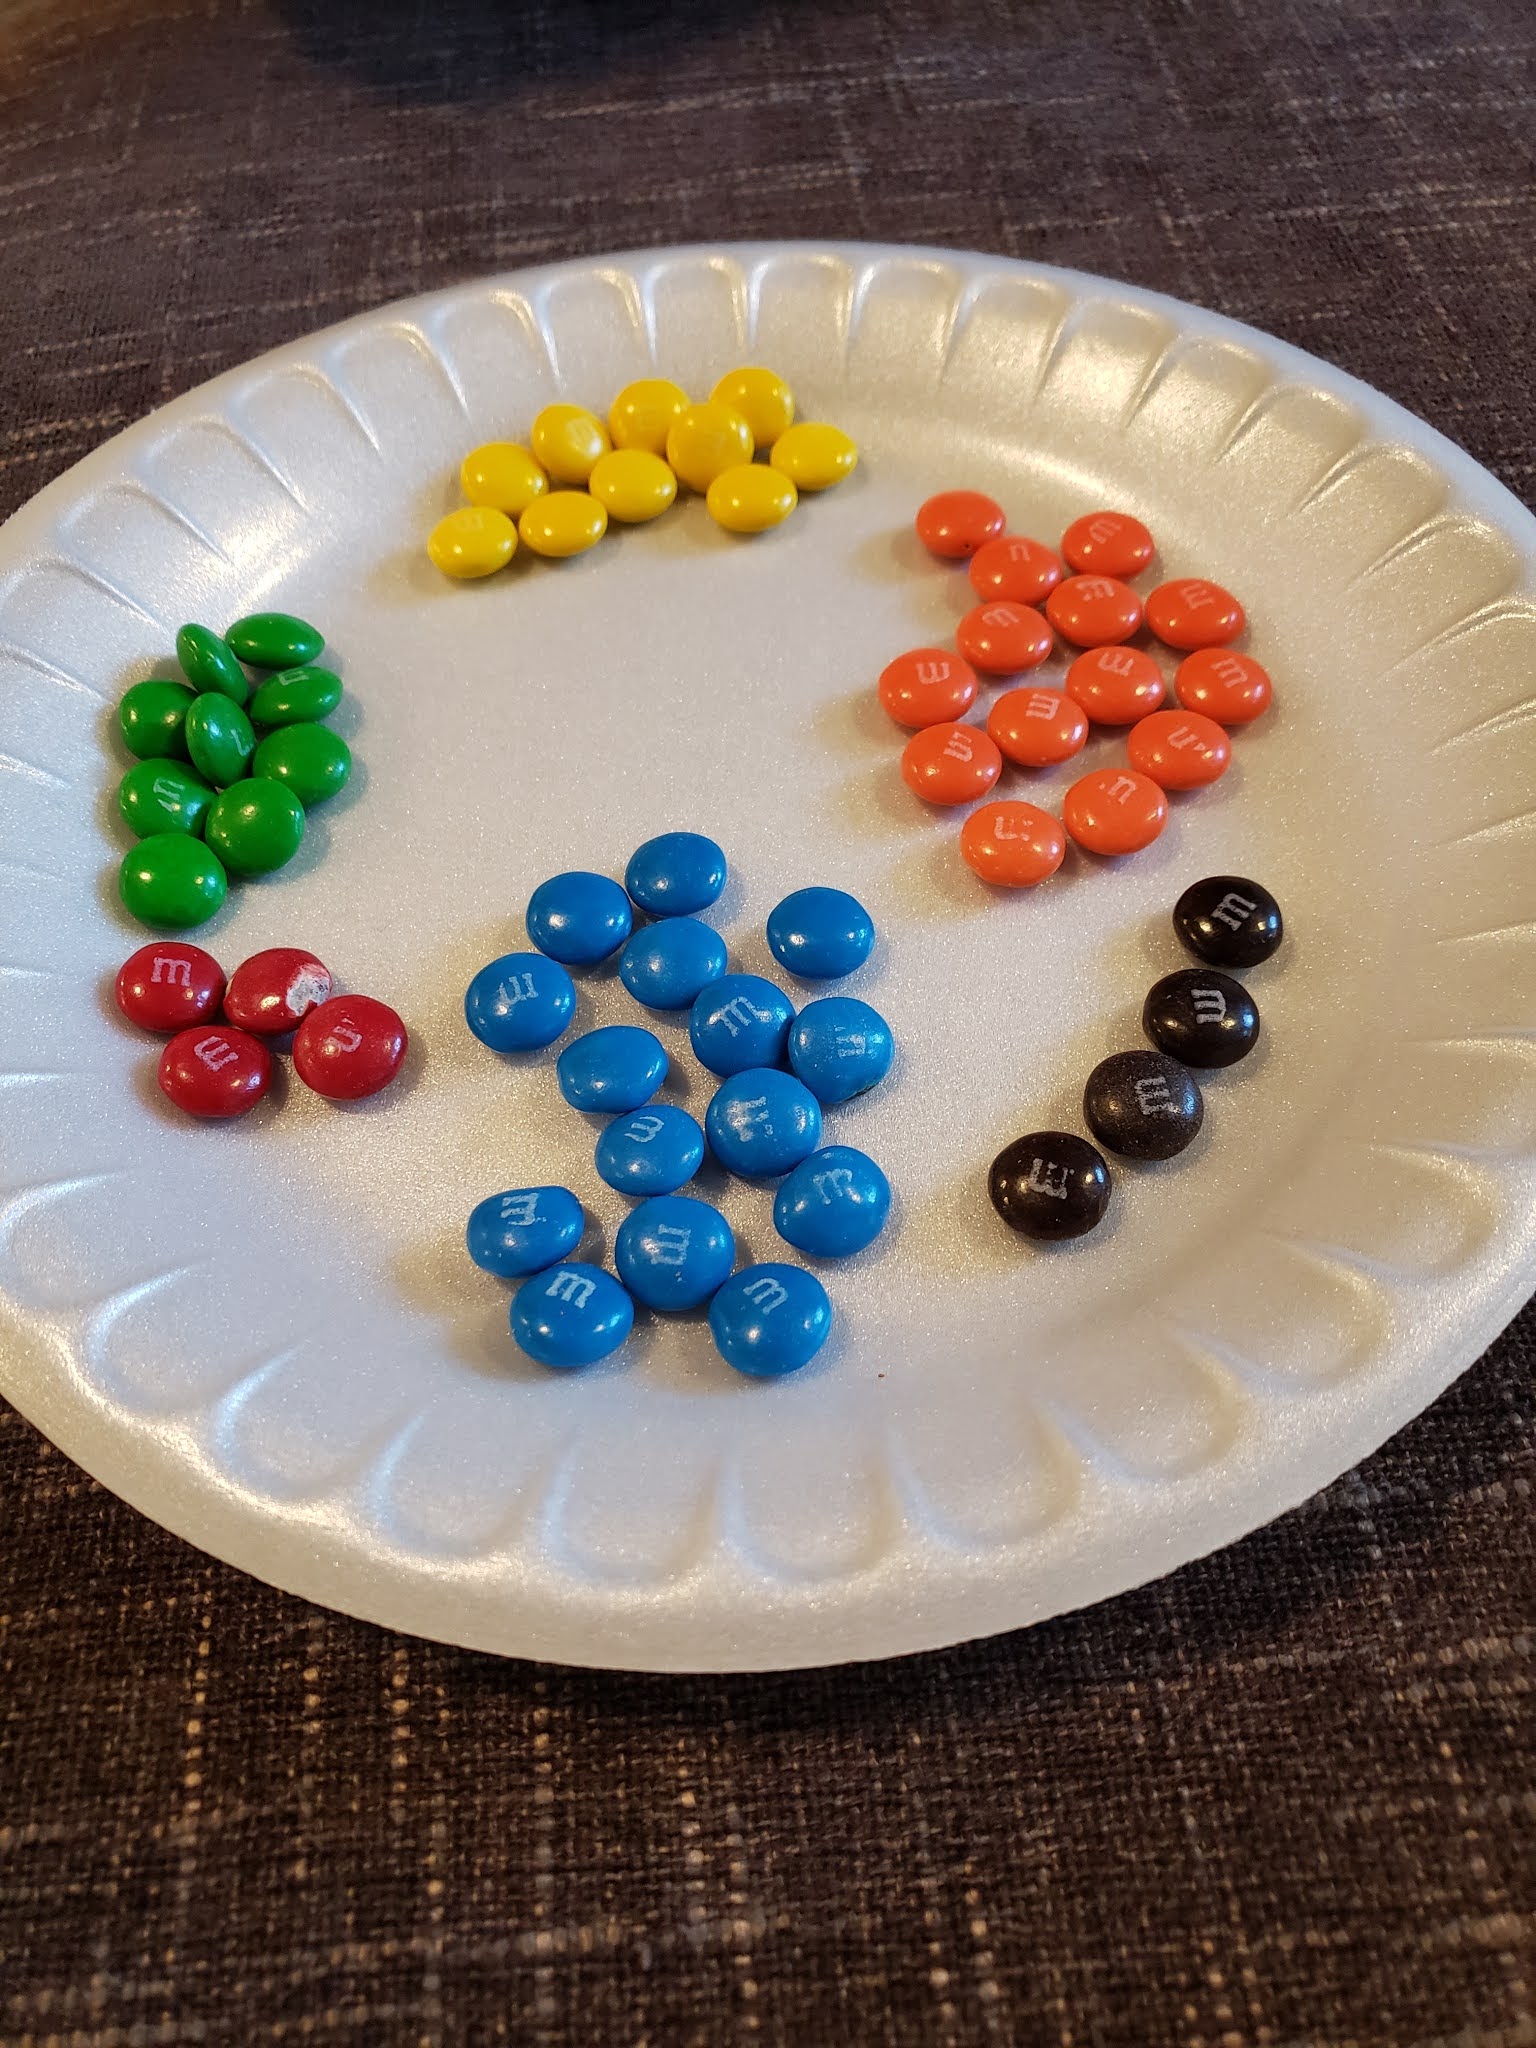
After they have made their predictions, give them their bags of M&M's to sort through. They should sort them by color, then write the actual numbers in the chart next to their predictions.


When that is done, give them the last page of the printout for them to fill in the graph. This will help them see the different amounts next to each other and better see what amounts had more or less than the other colors. After that have them answer the questions next to the chart. You can then have them discuss their different answers and why some of the students got different answers than others.


No comments:
Post a Comment